Tableau or Power BI: When to Choose Which, and Why

Tableau (Salesforce) and Power BI are two mature tools. Both build dashboards, connect to a wide range of sources and look good in a presentation. At that level, there is little to tell them apart. The differences start to show when we ask who will be using the tool, how well our data is organized, and what it will cost us three years from now, when we have 80 reports instead of 8.
The most common mistake we see is starting with a feature list, or with whichever tool the analytics team happens to prefer. That leads nowhere. A better question is which ecosystem the company already lives in, and what role the BI tool should play: an extension of the Microsoft environment, or a separate exploration layer on top of an independent data warehouse.
Two different philosophies
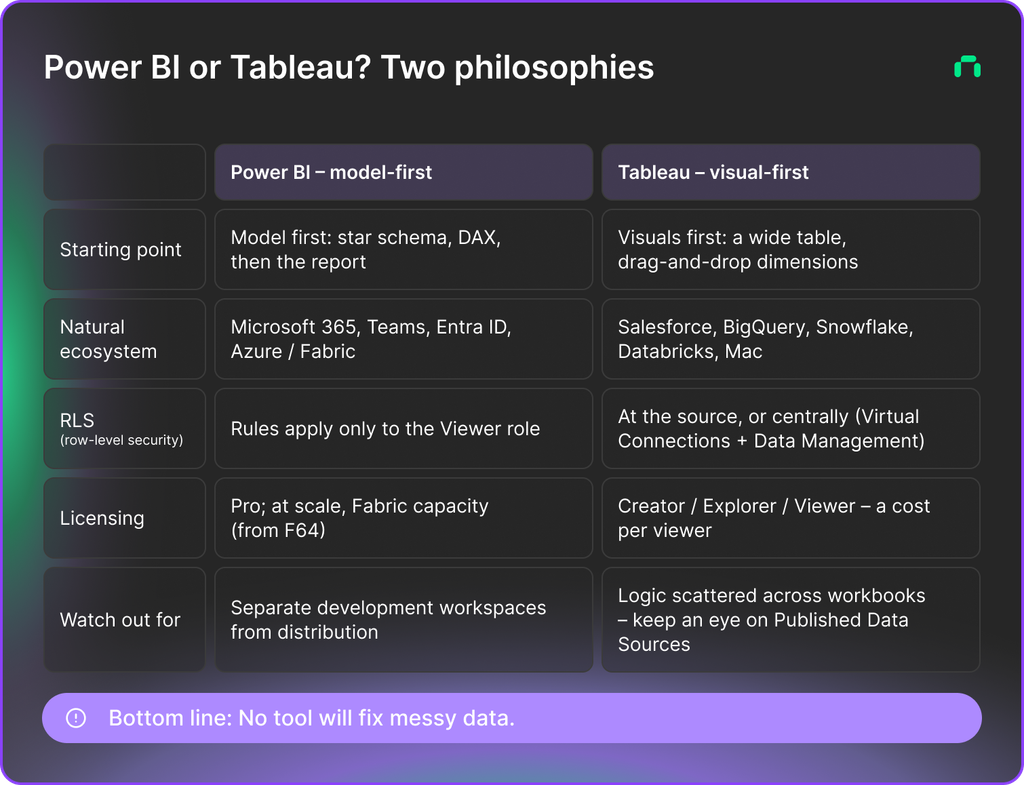
Power BI pushes you toward model-first thinking. First you arrange the data into a star schema, build a semantic model and write measures in DAX. Only then do you start drawing. The VertiPaq engine rewards this discipline with performance and consistency. If you change the definition of margin in one model, it changes in every report connected to that model.
Tableau goes the opposite way – visual-first. You can take a wide table from BigQuery or Snowflake and start dragging dimensions right away. The VizQL engine and LOD expressions (FIXED, INCLUDE, EXCLUDE) give you plenty of freedom for ad hoc analysis. It’s a tool that doesn’t break an analyst’s flow. The downside: business logic can easily end up scattered across individual workbooks if you don’t keep Published Data Sources under control.
The ecosystem often matters more than features
If a company runs on Microsoft 365, Teams, Entra ID and Azure (or Fabric), Power BI is the natural choice. Reports show up as a tab in Teams, a financial analyst connects to the semantic model straight from Excel, and permissions are managed through the same groups as everywhere else in the company. It’s a batteries included setup – there’s no separate island to build.
Tableau makes sense when:
- Salesforce is at the heart of the business (CRM + Data Cloud),
- the data lives in BigQuery, Snowflake or Databricks and you deliberately want to avoid vendor lock-in,
- the analytics team works mostly on Macs (Tableau Desktop runs natively; Power BI Desktop doesn’t).
Data architecture matters more than the tool
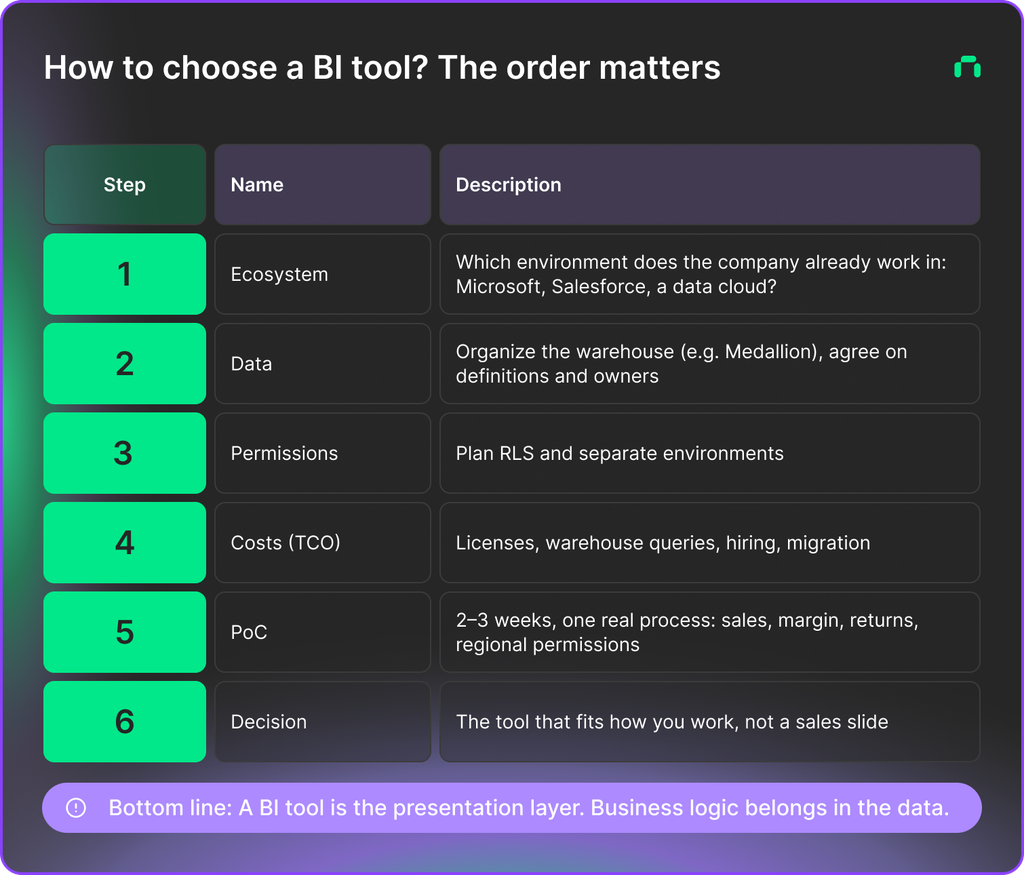
No BI tool will fix a mess in the source data. If sales, finance and marketing each define an “active customer” differently, even the best-looking dashboard will start arguments in the boardroom. First, organize the data in the warehouse (ideally in layers, for example with the Medallion architecture), agree on definitions and owners, and only then connect BI. The tool should be a presentation layer, not the place where business logic gets stitched together on the fly.
RLS (Row-Level Security) and permissions – an easy place to slip up
Both tools support RLS, but the devil is in the details.
In Power BI, RLS rules apply only to users with the Viewer role. Users with the Admin, Member or Contributor role in a workspace always see all the data, even if they are assigned to an RLS role. That’s why development workspaces need to be strictly separated from the distribution layer (Apps + Audiences).
In Tableau, you can implement RLS at the source (a permissions table) or centrally through Virtual Connections. The latter, however, requires Tableau Data Management, so factor it into the budget.
Licensing and TCO (total cost of ownership)
Power BI wins with a lower barrier to entry. The Pro license is inexpensive (or already included in Microsoft 365 E5). At large scale (hundreds of viewers), you move to Fabric capacity (from F64), and viewers no longer need paid licenses. Tableau uses a Creator / Explorer / Viewer model, so every viewer is a recurring cost. With several hundred users, the difference in licensing costs becomes noticeable.
But licenses aren’t everything. TCO also includes:
- data warehouse query costs (especially with DirectQuery / Live),
- talent availability in the market (in Poland, Power BI and DAX experts are significantly easier to find),
- the cost of a potential migration.
If we already have 60 reports in one tool and a team that knows it well, migrating just to cut the subscription cost usually doesn’t pay off. The effort and the risk of new errors can outweigh the savings on licenses.
Is it worth switching after years of use?
We often hear: “We’ve had Tableau for five years, but we already have E5 – maybe we should move to Power BI?” Or the other way around. There is no magic migration tool between the two. You have to re-model the relationships, rewrite the logic (LOD expressions into DAX, or vice versa), and rebuild the visualizations and permissions. That is a significant cost.
Switching only makes sense if you’re facing a rebuild of your data architecture anyway. In that case, it’s better to treat it as a hard reset: first the warehouse and Data Governance, then the choice of tool. The best approach is to compare both tools in a short PoC (proof of concept, 2–3 weeks) on one concrete business process: sales, margin, returns and regional permissions. That shows which tool actually fits the way you work, rather than a vendor’s sales slide.
Summary
Choosing a BI tool is a consequence of decisions about data, not the starting point. First the ecosystem, architecture and permissions; only then licenses and features. If you’re facing this choice, we’d be happy to compare both tools using your own process.
From data to decisions
We help you organise your data before you choose the tool.
You might also like

DevOps & WebDev under one roof – what our clients gain by optimizing infrastructure with us
We share 3 real examples where DevOps made a real difference for our clients & explain why collaboration between WebDev and DevOps engineers matters more [...]

When is it worth switching from shared hosting to a private cloud?
Discover the signals suggesting it's time to upgrade from shared hosting to a private cloud and learn what to pay attention to when switching.

Banking websites as strategic assets: meeting customer and regulatory demands
Why Polish and European banks cannot afford to underestimate the importance of website quality? Here's about four key areas where financial institutions must excel to [...]